文章同步更新于我的个人博客:松果猿的博客,欢迎访问获取更多技术分享。
同时,您也可以关注我的微信公众号:松果猿的代码工坊,获取最新文章推送和编程技巧。
前言
上一期我们将这个系统的前端部分的大致框架构建好了,现在我们继续后续的开发任务
加载南京geojson文件
加载本地geojson文件,在asset下添加/data/nanjing.json,这里推荐一个网站进行地图格式转换:https://mapshaper.org/。通过如下方法进行加载:
导入json文件:
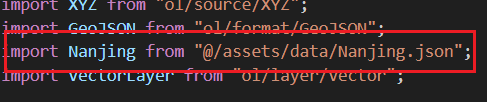
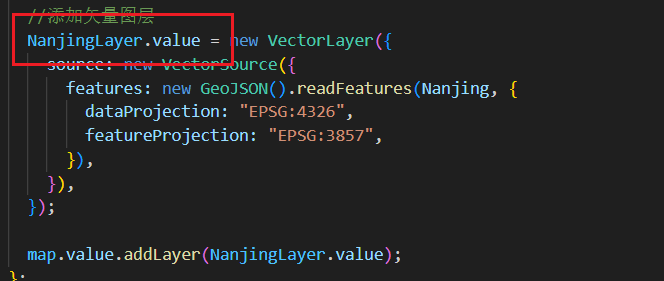
添加一个矢量图层用于加载南京geojson文件
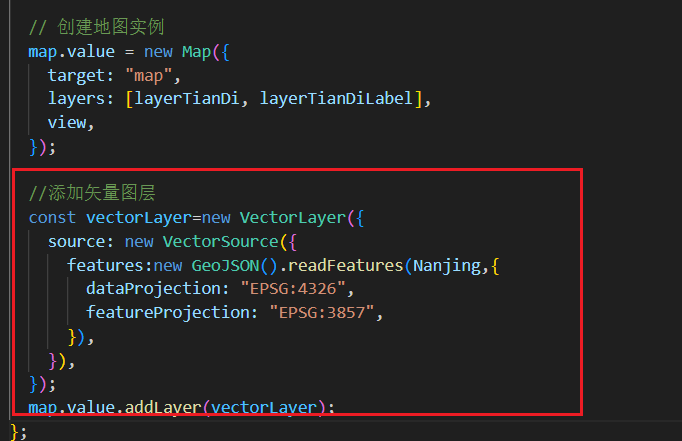
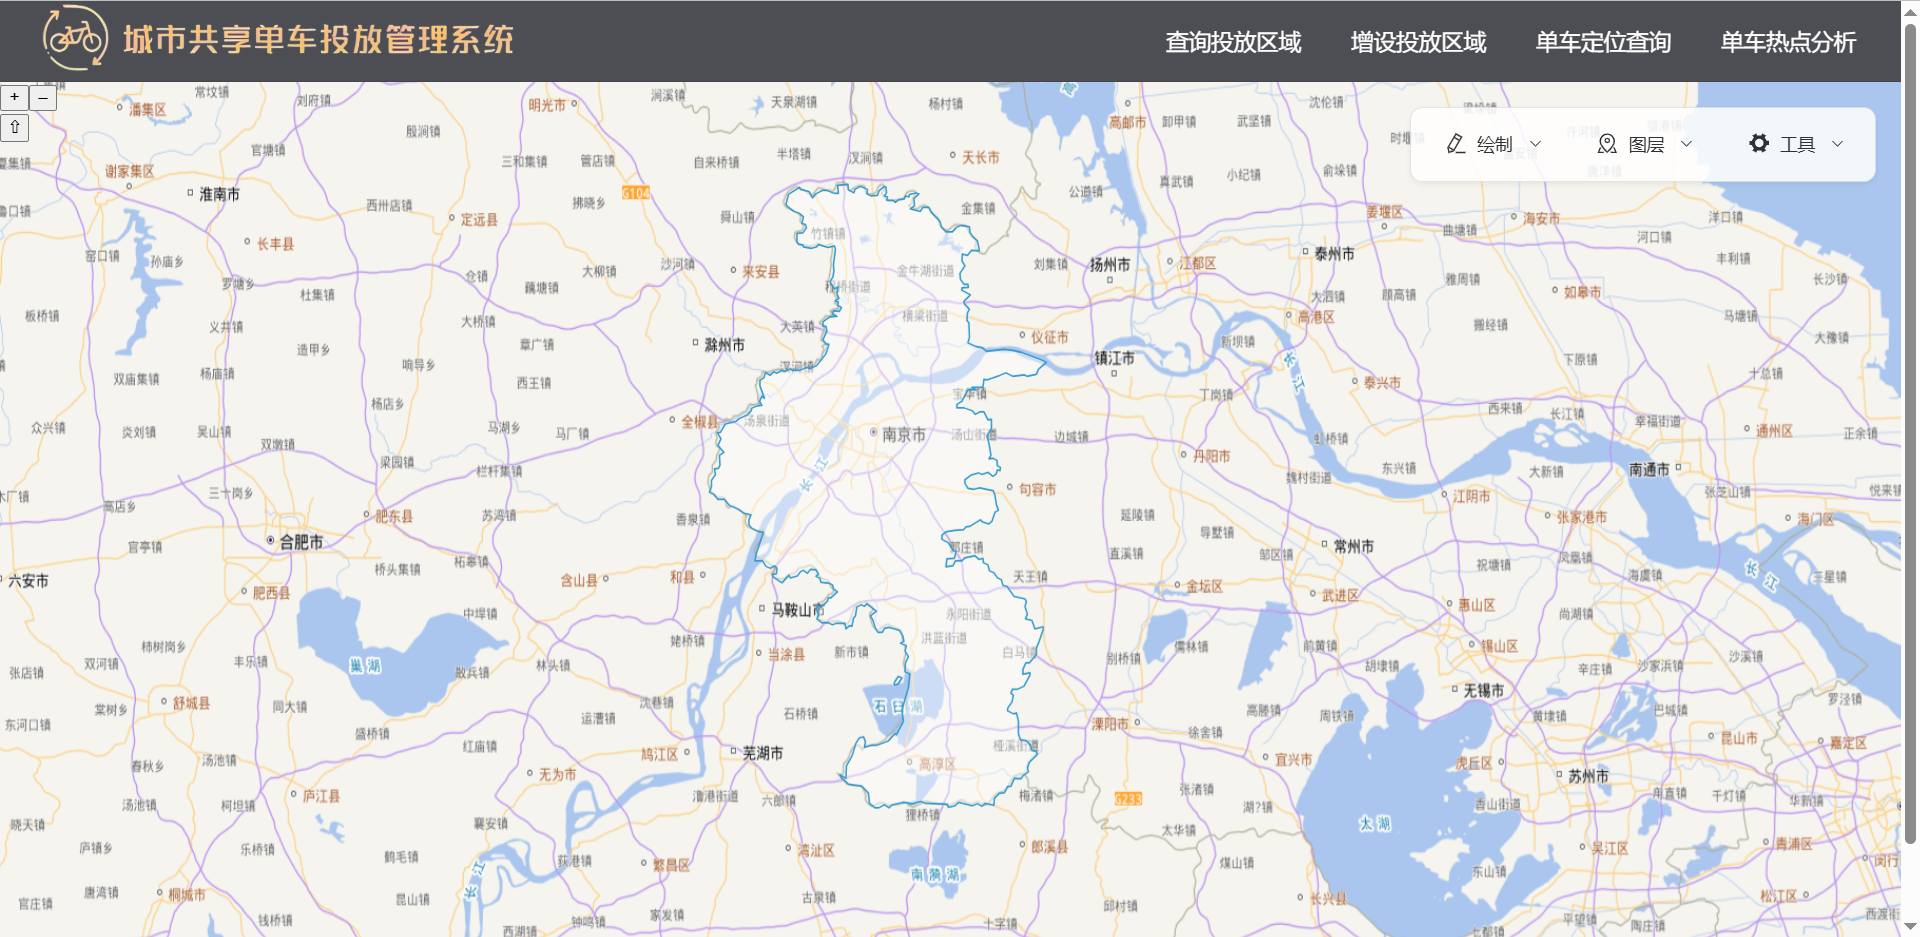
这样南京矢量边界就添加上去了
实现绘制点线面功能
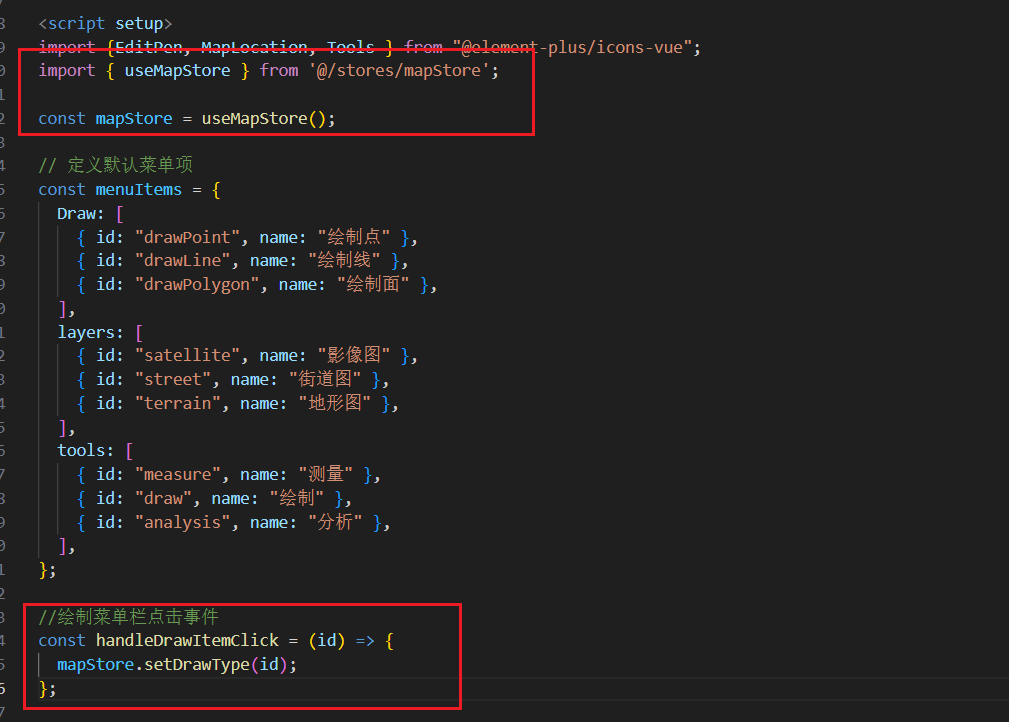
地图菜单栏和地图怎么实现通信呢,我们用pinia
新建@/stores/mapStore.js,用于绘制操作的状态管理
@/stores/mapStore.js
1
2
3
4
5
6
7
8
9
10
11
12
13
14
15
16
17
18
19
20
21
| import { defineStore } from 'pinia';
export const useMapStore = defineStore('map', {
state: () => ({
currentDrawType: null,
vectorSource: null,
}),
actions: {
setDrawType(type) {
this.currentDrawType = type;
},
setVectorSource(source) {
this.vectorSource = source;
},
clearDraw() {
if (this.vectorSource) {
this.vectorSource.clear();
}
}
},
});
|
currentDrawType用于存储当前绘制类型(点线面),vectorSource用于存储当前绘制矢量图层源,用于操作后续的清除绘制图层操作,setDrawType(type) 用于设置当前绘制类型,setVectorSource用于设置当前矢量数据源,clearDraw()用于进行矢量图层的清除操作
新建@/components/DrawButton.vue
1
2
3
4
5
6
7
8
9
10
11
12
13
14
15
16
17
18
19
20
21
22
23
24
25
26
27
28
29
30
31
32
| <template>
<div class="draw-button">
<el-button type="primary" @click="stopDraw">结束绘制</el-button>
<el-button type="warning" @click="clearDraw">清空绘制</el-button>
</div>
</template>
<script setup>
import { useMapStore } from "@/stores/mapStore";
const mapStore = useMapStore();
const stopDraw = () => {
mapStore.setDrawType(null);
};
const clearDraw = () => {
mapStore.clearDraw();
};
</script>
<style scoped>
.draw-button{
display: flex;
justify-content: center;
align-items: center;
position: absolute;
top: 20px;
left: 50%;
transform: translateX(-50%);
gap: 10px;
}
</style>
|
这个组件用于进行绘制的停止清除功能
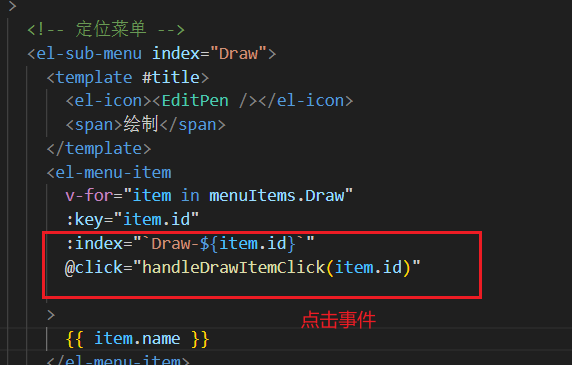
在@/components/MapControl.vue中添加如下代码将绘制类型存储在pinia中
再来到components/OlMap.vue中
添加绘制图层的矢量源和图层:
1
2
3
4
5
6
7
8
9
10
11
12
13
14
15
16
17
18
19
| const vectorSource = ref(new VectorSource());
const Drawvector = new VectorLayer({
source: vectorSource.value,
style: new Style({
fill: new Fill({
color: "rgba(255, 255, 255, 0.5)",
}),
stroke: new Stroke({
color: "#ffcc33",
width: 2,
}),
image: new Circle({
radius: 7,
fill: new Fill({
color: "#ffcc33",
}),
}),
}),
});
|
在挂载钩子中添加
1
2
3
4
5
| onMounted(() => {
initMap();
// 设置矢量数据源
mapStore.setVectorSource(vectorSource.value);
});
|
添加绘制交互
1
2
3
4
5
6
7
8
9
10
11
12
13
14
15
16
17
18
19
20
21
22
23
24
25
26
27
28
29
|
const addDrawInteraction = (drawType) => {
  if (draw.value) {
    map.value.removeInteraction(draw.value);
  }

  let geometryType;
  switch (drawType) {
    case "drawPoint":
      geometryType = "Point";
      break;
    case "drawLine":
      geometryType = "LineString";
      break;
    case "drawPolygon":
      geometryType = "Polygon";
      break;
    default:
      return;
  }


  draw.value = new Draw({
    source: vectorSource.value,
    type: geometryType,
  });

  map.value.addInteraction(draw.value);
};
|
监听pinia中数据的变化,当绘制交互改变时
1
2
3
4
5
6
| watch(
() => mapStore.currentDrawType,
(newType) => {
addDrawInteraction(newType);
}
);
|
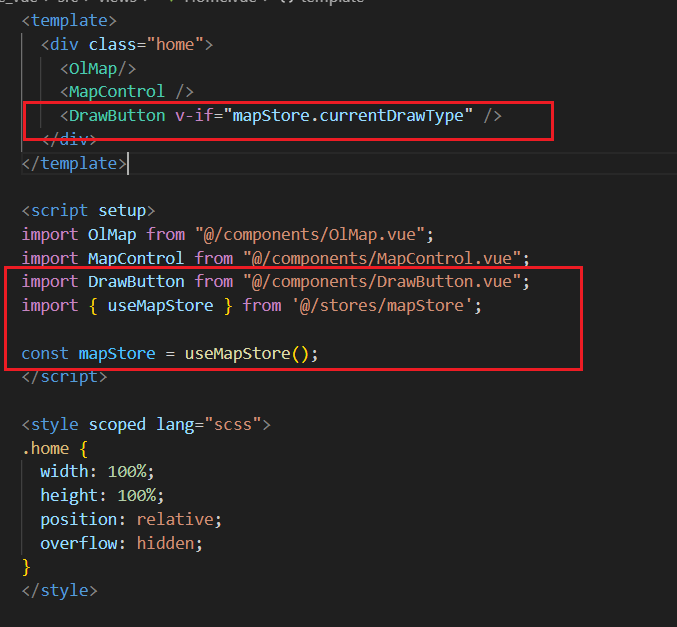
把绘制操作组件引入主页页面
实现弹窗以及高亮显示
我在上一期说过openlayer内置有业务图层对象Overlayers,这个图层可以展示弹框
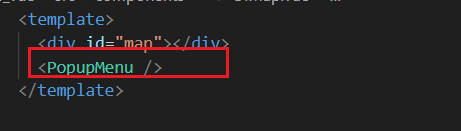
新建@/components/PopupMenu.vue
1
2
3
4
5
6
7
8
9
10
11
12
13
14
15
16
17
18
19
20
21
22
23
24
25
26
27
28
29
30
31
32
33
34
35
36
37
38
39
40
41
42
43
44
45
46
47
48
49
50
51
52
53
54
55
56
57
58
| <template>
<div id="popup" class="ol-popup">
<a
href="#"
id="popup-closer"
class="ol-popup-closer"
@click="closePopup"
></a>
<div id="popup-content"></div>
</div>
</template>
<script setup>
</script>
<style scoped>
/*弹出框样式*/
.ol-popup {
position: absolute;
bottom: 12px;
left: -50px;
background-color: white;
box-shadow: rgb(247, 247, 241);
padding: 15px;
border-radius: 10px;
border: 1px solid #cccccc;
min-width: 280px;
}
.ol-popup:after {
position: absolute;
top: 100%;
height: 0px;
width: 0px;
left: 48px;
content: "";
margin-left: -11px;
border-width: 11px;
border: 1px solid transparent;
}
.ol-popup:after {
border-top-color: white;
}
.ol-popup-closer {
text-decoration: none;
position: absolute;
top: 2px;
right: 8px;
}
.ol-popup-closer:after {
content: "⨉";
}
</style>
|
引入:
设置响应类型和高亮样式:
1
2
3
4
5
6
7
8
9
10
11
12
| const popup = ref(null);
const highlightStyle = new Style({
stroke: new Stroke({
color: "red",
width: 3,
}),
fill: new Fill({
color: "rgba(255,0,0,0.1)",
}),
});
|
添加监听事件
1
2
3
4
5
6
7
8
9
10
11
12
13
14
15
16
17
18
19
20
21
22
23
24
25
26
27
28
29
30
31
32
33
34
35
36
37
38
39
40
41
42
43
44
45
46
47
48
49
50
51
52
53
54
55
56
|
const addPopup = () => {
const container = document.getElementById("popup");
const content = document.getElementById("popup-content");
const closer = document.getElementById("popup-closer");
closer.onclick = () => {
popup.value.setPosition(undefined);
};
popup.value = new Overlay({
element: container,
autoPan: true,
autoPanAnimation: {
duration: 250,
},
});
map.value.addOverlay(popup.value);
let highlightedFeature = null;
map.value.on("click", (evt) => {
const feature = map.value.forEachFeatureAtPixel(
evt.pixel,
(feature, layer) => {
if (layer === NanjingLayer.value && !draw.value) {
return feature;
}
}
);
if (highlightedFeature) {
highlightedFeature.setStyle(undefined);
highlightedFeature = null;
}
if (feature) {
const coordinates = evt.coordinate;
feature.setStyle(highlightStyle);
highlightedFeature = feature;
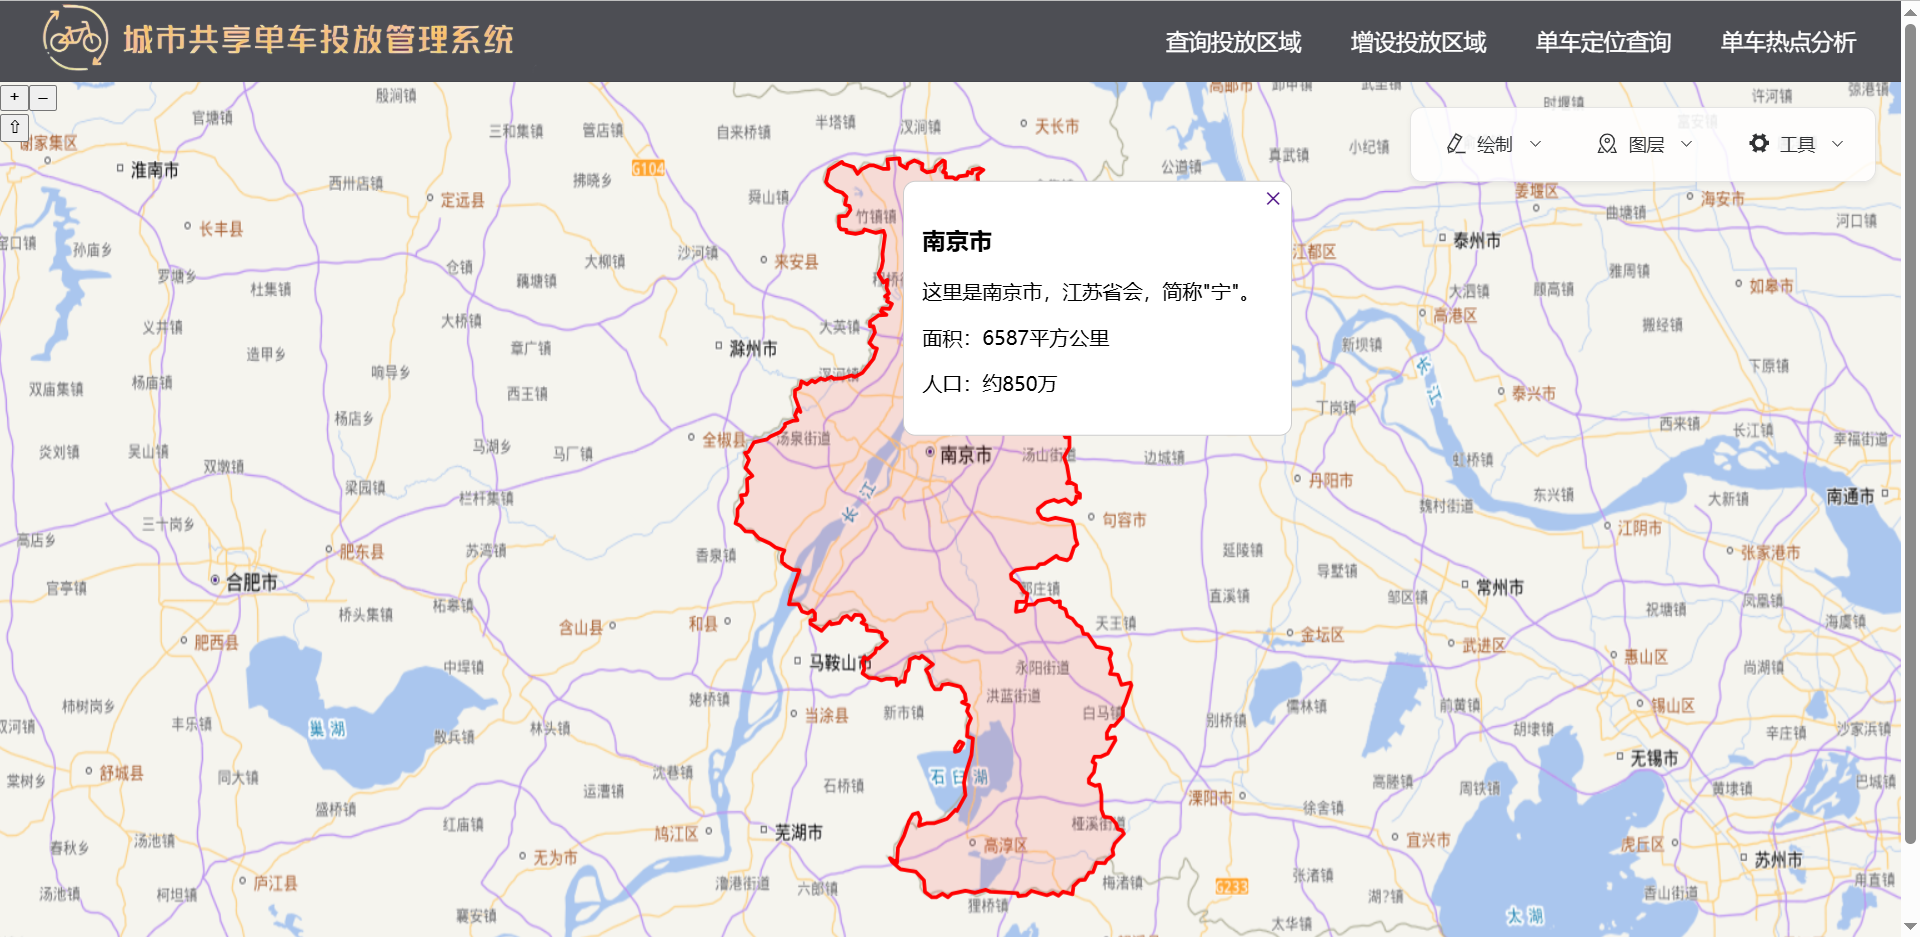
content.innerHTML = `
<h3>南京市</h3>
<p>这里是南京市,江苏省会,简称"宁"。</p>
<p>面积:6587平方公里</p>
<p>人口:约850万</p>
`;
popup.value.setPosition(coordinates);
} else {
popup.value.setPosition(undefined);
}
});
};
|
注意要把之前的南京矢量图层设置为响应类型,因为高亮显示在监听点击事件时检验是否为南京图层:layer === NanjingLayer.value && !draw.value引用了该图层
ok,完成了
高亮显示:
绘制操作:
如果有疑问或者文章有错误的,请在评论区提出,我看到一定会解答
项目地址:https://github.com/songguo1/Share_bike